Classify reads
Reads can be classified taxonomically using k-mer based methods. Two popular programs for this purpose are Centrifuge and Kraken2. The workflow can run both tools on all samples specified in your sample annotation file and produce interactive krona-plots and kraken-style reports.
Database construction for kraken and centrifuge is not part of this workflow. Please refer to the respective documentation for these tools (Kraken manual, Centrifuge manual). However, both tools have pre-built indices which saves you the trouble of downloading and building these on your own.
Individual krona plots are created in results/centrifuge/ and results/kraken/. Combined krona plots are created in
results/report/centrifuge and results/report/kraken. The kraken-style *.kreport files created within these
directories can be loaded into the tool pavian. Either install the pavian R package or run it using Docker
(see instructions at the GitHub repo).
Centrifuge
Relevant settings for Centrifuge are:
centrifuge_prebuilt: By default, the workflow uses the prebuilt p+h+v index containing
prokaryotic, viral and human sequences which it will download from the
centrifuge FTP. Other valid choices are:
p_compressed+h+v, p_compressed_2018_4_15, nt_2018_2_12 and nt_2018_3_3. The index will
be downloaded to resources/classify_db/centrifuge/.
centrifuge_custom: If you have created your own custom centrifuge index, specify the its path here, excluding
the .*.cf suffix.
centrifuge_summarize_rank: The centrifuge index can be summarized to see number of sequences and total size in
bp for each taxa at a certain rank specified by this config parameter (superkingdom by default). To generate the
summary file run:
snakemake --config centrifuge=True centrifuge_summary
The summary output will be placed in the same directory as the centrifuge index (resources/classify_db/centrifuge if using the prebuilt index) in a file with the suffix ‘.summary.tab’.
centrifuge_max_assignments: This determines how many assignments are made per read. By default this parameter
is set to 1 in this workflow which means centrifuge runs in ‘LCA’ mode similar to kraken where only the lowest common
ancestor of all hits is assigned for a read. The default setting for centrifuge is 5.
centrifuge_min_score: This is used to filter out classifications when creating the kraken-style report. Note
that this also influences the numbers in the Krona plots.
You can try out the Centrifuge read classifier by using one of the supplied examples. To see the rules that would be run enter:
snakemake --configfile examples/centrifuge/config.yaml -np
Now perform the actual run with 4 cores:
snakemake --configfile examples/centrifuge/config.yaml -p -j 4
Kraken2
Relevant settings for Kraken2 are:
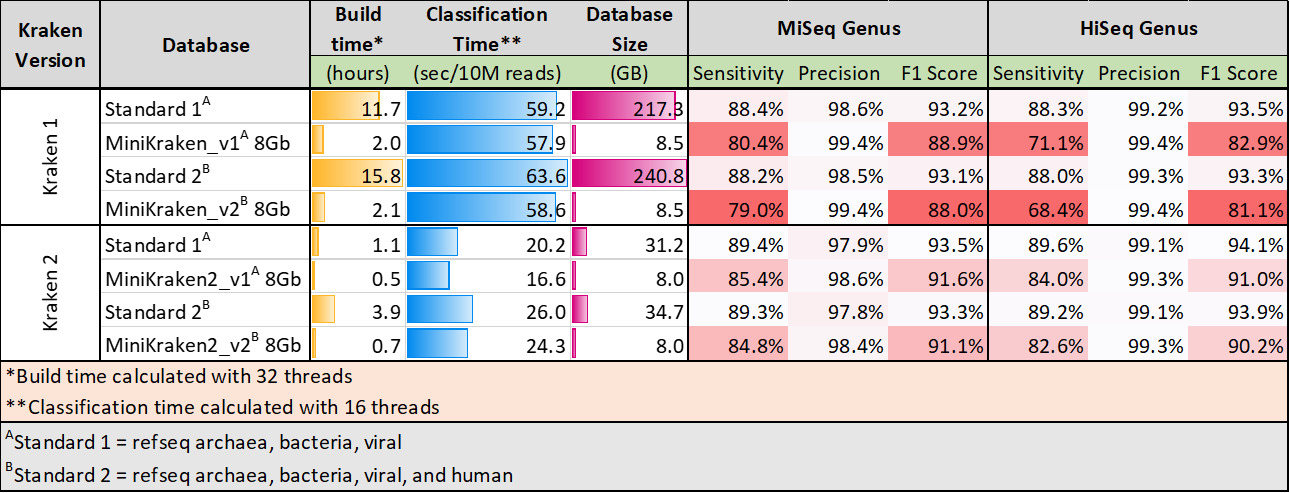
kraken_prebuilt: By default, the workflow uses the prebuilt MiniKraken2_v2_8GB database built from the
Refseq bacteria, archaea, and viral libraries and the GRCh38 human genome. Alternatively you can use
MiniKraken2_v1_8GB which will download the database excluding the human genome. These minikraken databases
are downsampled versions of the standard database which could influence sensitivity. However,
evaluations suggest that with
kraken2 the drop in sensitivity is minimal.
kraken_custom: If you have created your own custom centrifuge index, specify the path to the directory
containing the hash.k2d, opts.k2d and taxo.k2d files.
kraken_reduce_memory: Set to True to run kraken2 with --memory-mapping which reduces RAM usage.
Try out the Kraken2 read classifier using the supplied example:
snakemake --configfile examples/kraken/config.yaml -np
Filtering results
Sometimes you may see taxa pop up in your classification output that you are not sure are really there. The k-mer based methods such as Centrifuge and Kraken do not provide information on e.g. genome coverage that tools like bowtie2 or blast can give. However, for very large datasets and very large genome databases using read-aligners is not tractable due to extremely long running times.
This workflow can utilize the speed and low disk-space requirements of Centrifuge to obtain a set of ‘trusted’ genomes that are used for more detailed mapping analyses.
To try this out on the example above enter:
snakemake --configfile examples/centrifuge/config.yaml --config centrifuge_map_filtered=True -np -j 4
Because we set centrifuge_map_filtered=True the output from Centrifuge is now filtered in a two-step setup.
To perform the actual runs (again with 4 cores) do:
snakemake --configfile examples/centrifuge/config.yaml --config centrifuge_map_filtered=True -p -j 4
Below are explanations of the different filtering steps and the output produced.
Centrifuge filtering
First taxids with at least centrifuge_min_read_count assigned reads are identified
and the corresponding genome sequences are extracted from the Centrifuge
database. By default centrifuge_min_read_count is set to 5000.
Sourmash filtering
Next, genomes passing the first filter are passed to [sourmash](https://github.com/dib-lab/sourmash) which builds ‘MinHash’ signatures of the genomes. These signatures are essentially highly compressed representations of the DNA sequences. Signatures are also computed for each (preprocessed) sample and these are then queried against the filtered genome signatures. This gives an estimate of how much a genome is covered by a sample by comparing the MinHash signatures. Settings which influence how this filtering step is performed are:
sourmash_fraction: the number of hashes to compute as a fraciton of the
input k-mers. By default this is set to 100 meaning that 1/100 of the input
k-mer are used to compute the MinHash signature. Increasing the setting
will reduce the disk-space requirements but may also reduce performance.
sourmash_min_cov: This is the minimum coverage estimated from the sourmas filtering
step that a genome must have in order to pass to the next steps. By default
this is set to 0.1 meaning that a genome must be covered by at least 10%
in at least one of the samples.
Bowtie2 alignments
Finally, genomes that pass both filters are indexed using bowtie2 and the (preprocessed) reads are mapped to this set of genomes. The resulting bam-files are used to calculate coverage of genomes across samples.
Output
Under the results/examples/centrifuge_classify/report/ directory you will
find a bowtie2 sub-folder with indexed alignment files in bam format
as well as plots of:

genome coverage in each sample and:

average coverage per genome.
In addition, the bam files can be loaded directory into Pavian. See some instructions here).
Note that you will have to increase the `maxUploadSize`of the pavian app in order to load most bam files. If you installed pavian via R you can run the app as:
pavian::runApp(port=5000, maxUploadSize=500*1024^2)